Features · Analytics
The data center — your business, in six live dashboards
Every contract, payment, and stock movement your team records becomes analysis you don't have to build: sales, cash flow, supply chain, operational efficiency, and credit risk — live, drillable, and honest, because the source is the work itself.
01
One combined report, sliced three ways
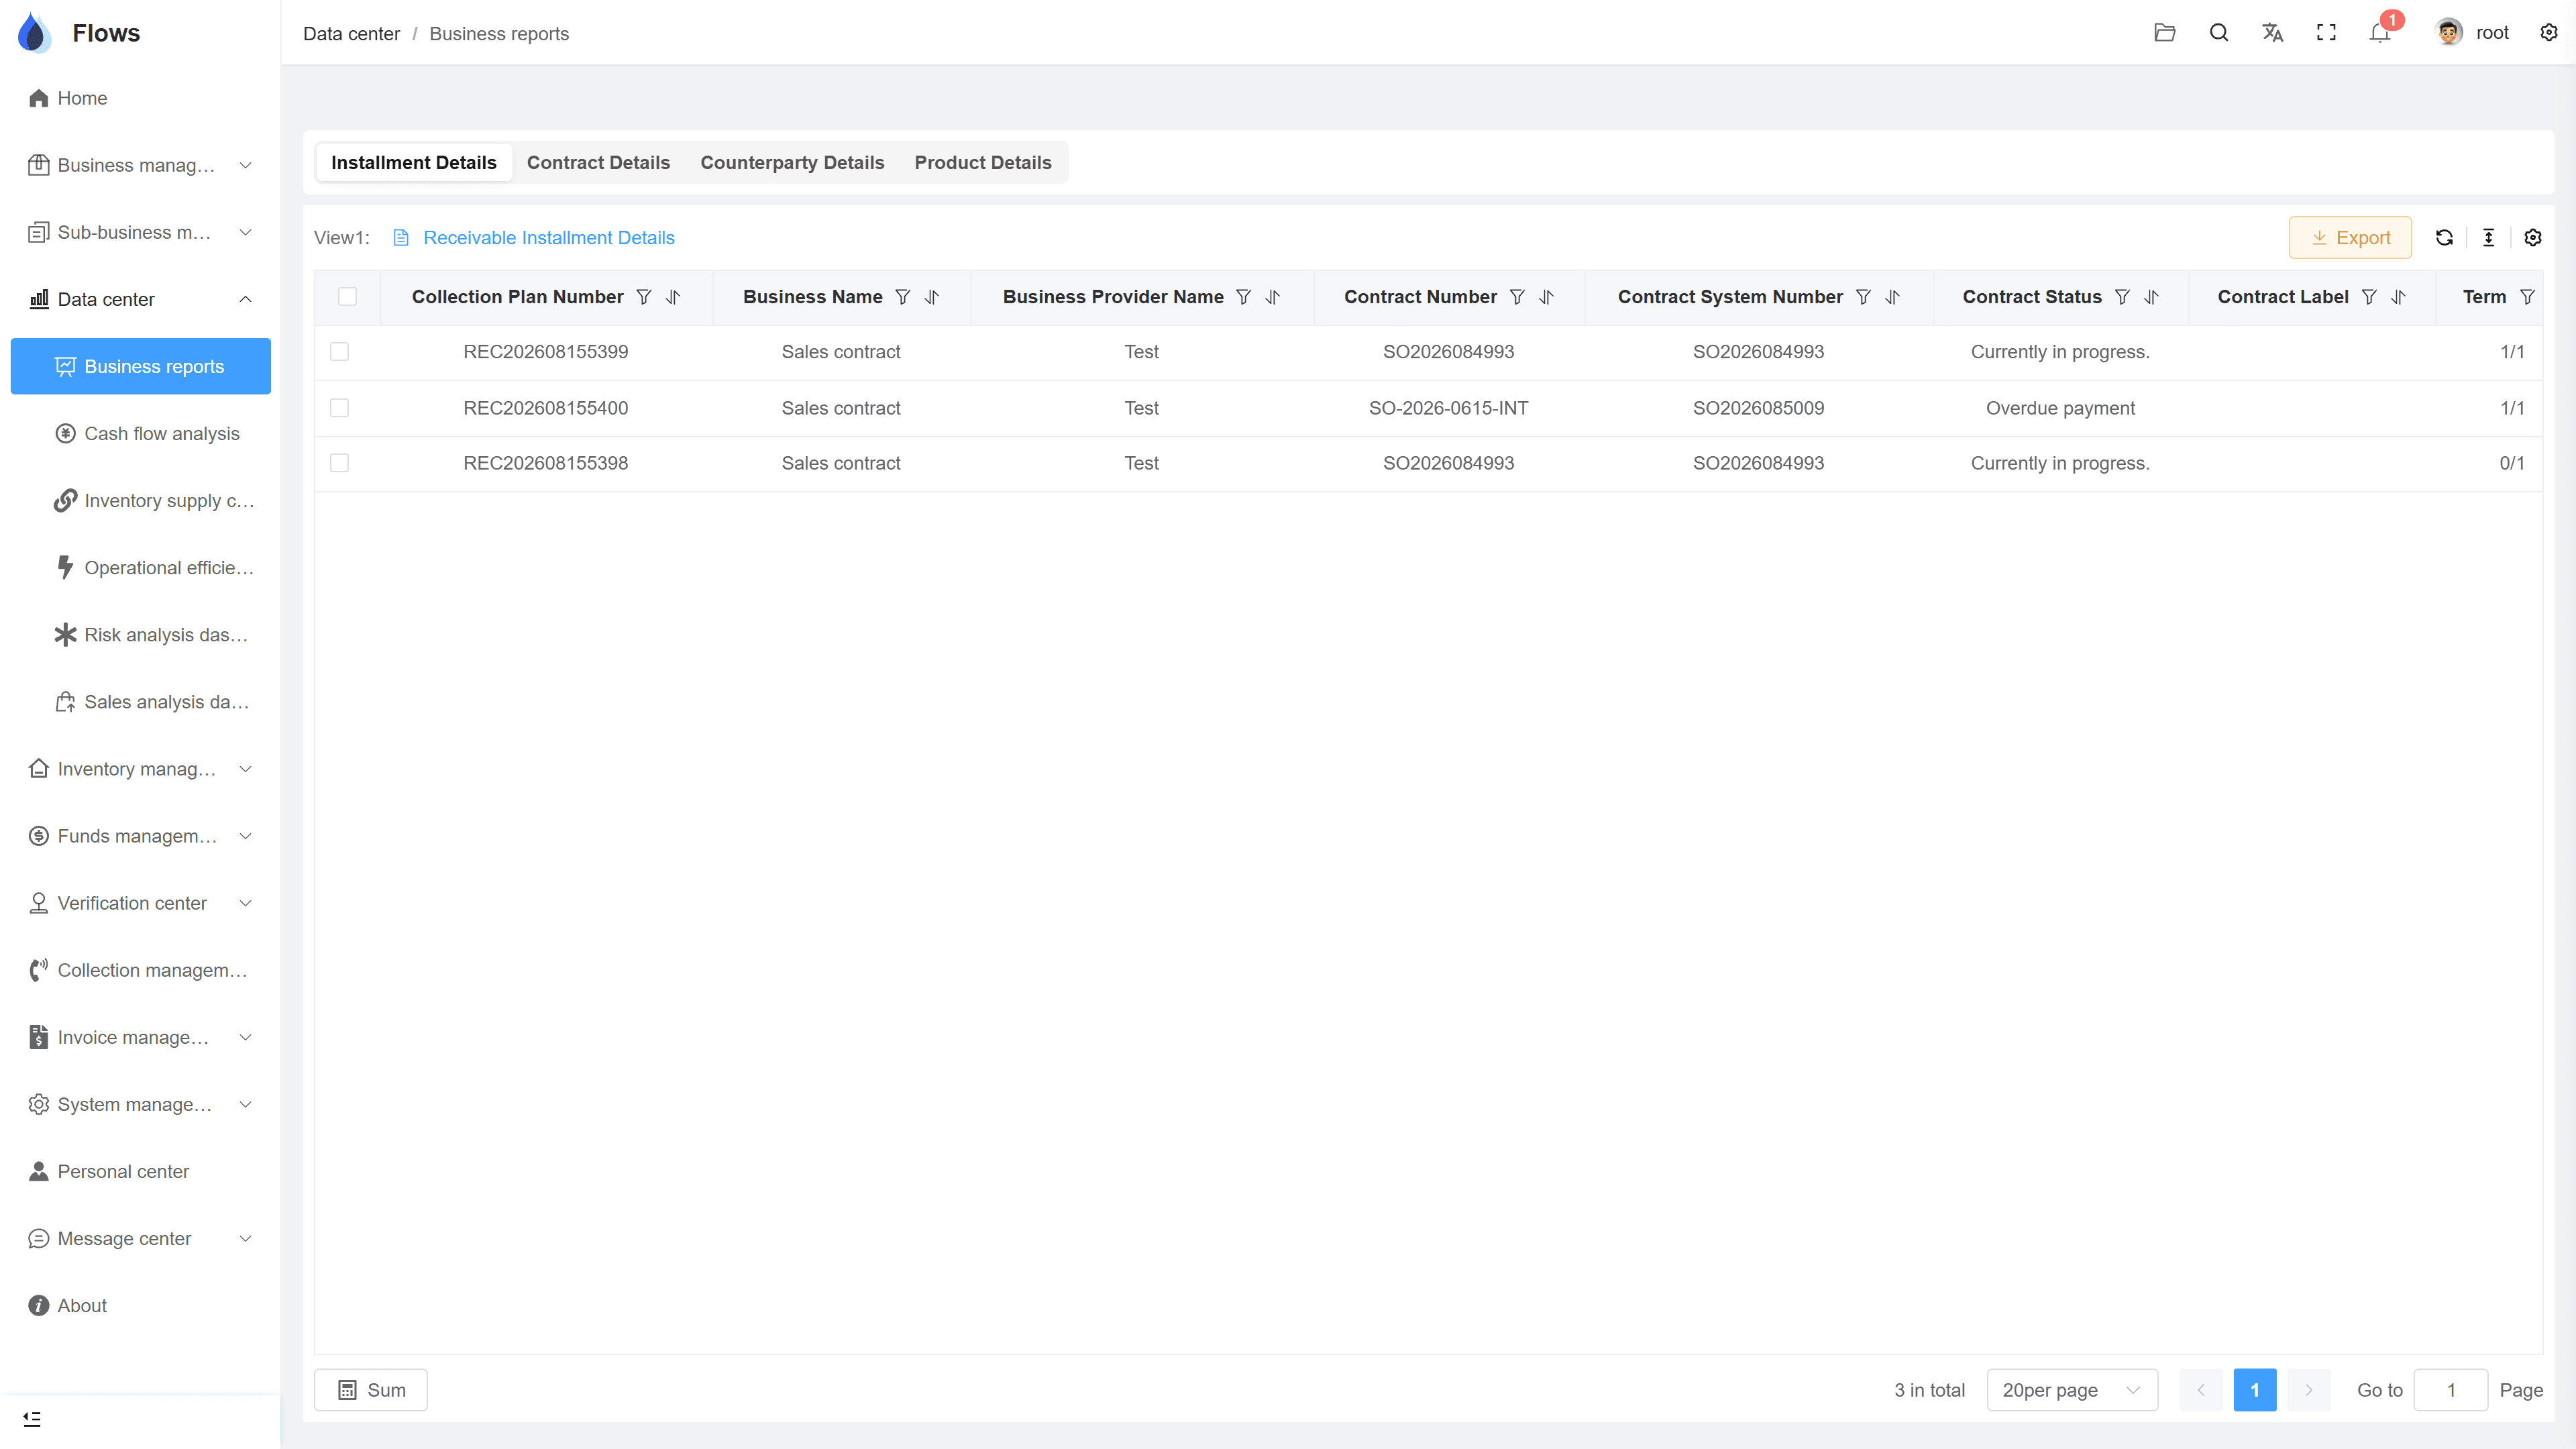
The statistics report merges customers, contracts, and movements into one table you can slice by payment period, by contract, or by customer and supplier — with an AR view and an AP view, plus a product in-out report for goods. Everything exports to Excel, attachments included.
- By period, contract, or counterparty
- AR and AP views
- Product in-out statistics
- Full Excel export
Contracts — money in & money out
Sales · money in
78% collected
Purchases · money out
55% paid on plan
Net cash this month
+฿204,100
02
Five analysis dashboards, zero setup
Cash flow shows balances, in-versus-out, plan-versus-actual, and a forecast. Supply chain covers stock value, receiving timeliness, turnover, and shortage prediction. Operational efficiency tracks AR/AP turnover days and aging. Risk watches overdue customers and recovery rates. Sales analyzes margins, top customers and products, and growth.
- Cash-flow analysis & forecast
- Supply-chain & turnover view
- AR/AP efficiency & aging
- Credit risk & sales analysis
Cash — all accounts
KBank •••4512
฿2,140,000
SCB •••8830
฿860,000
Live balances & account movements
Alerts when cash drops below your threshold
03
From dashboard to decision
The point isn't charts — it's what you do next. Aging worsening? The write-off center has the periods. A customer's risk rising? Collections has the timeline. A product turning slowly? Inventory has the stock cards. Every number leads back to the records behind it.
- Risk feeds collections work
- Aging feeds the AR desk
- Turnover feeds purchasing
- Numbers trace to records
Collection record — TCH Motors
Penalty accrued
฿69,820
Daily at 15% p.a. · 43 days overdue
Inside the module
Real screens from Flows ERP — what your team will actually work in.
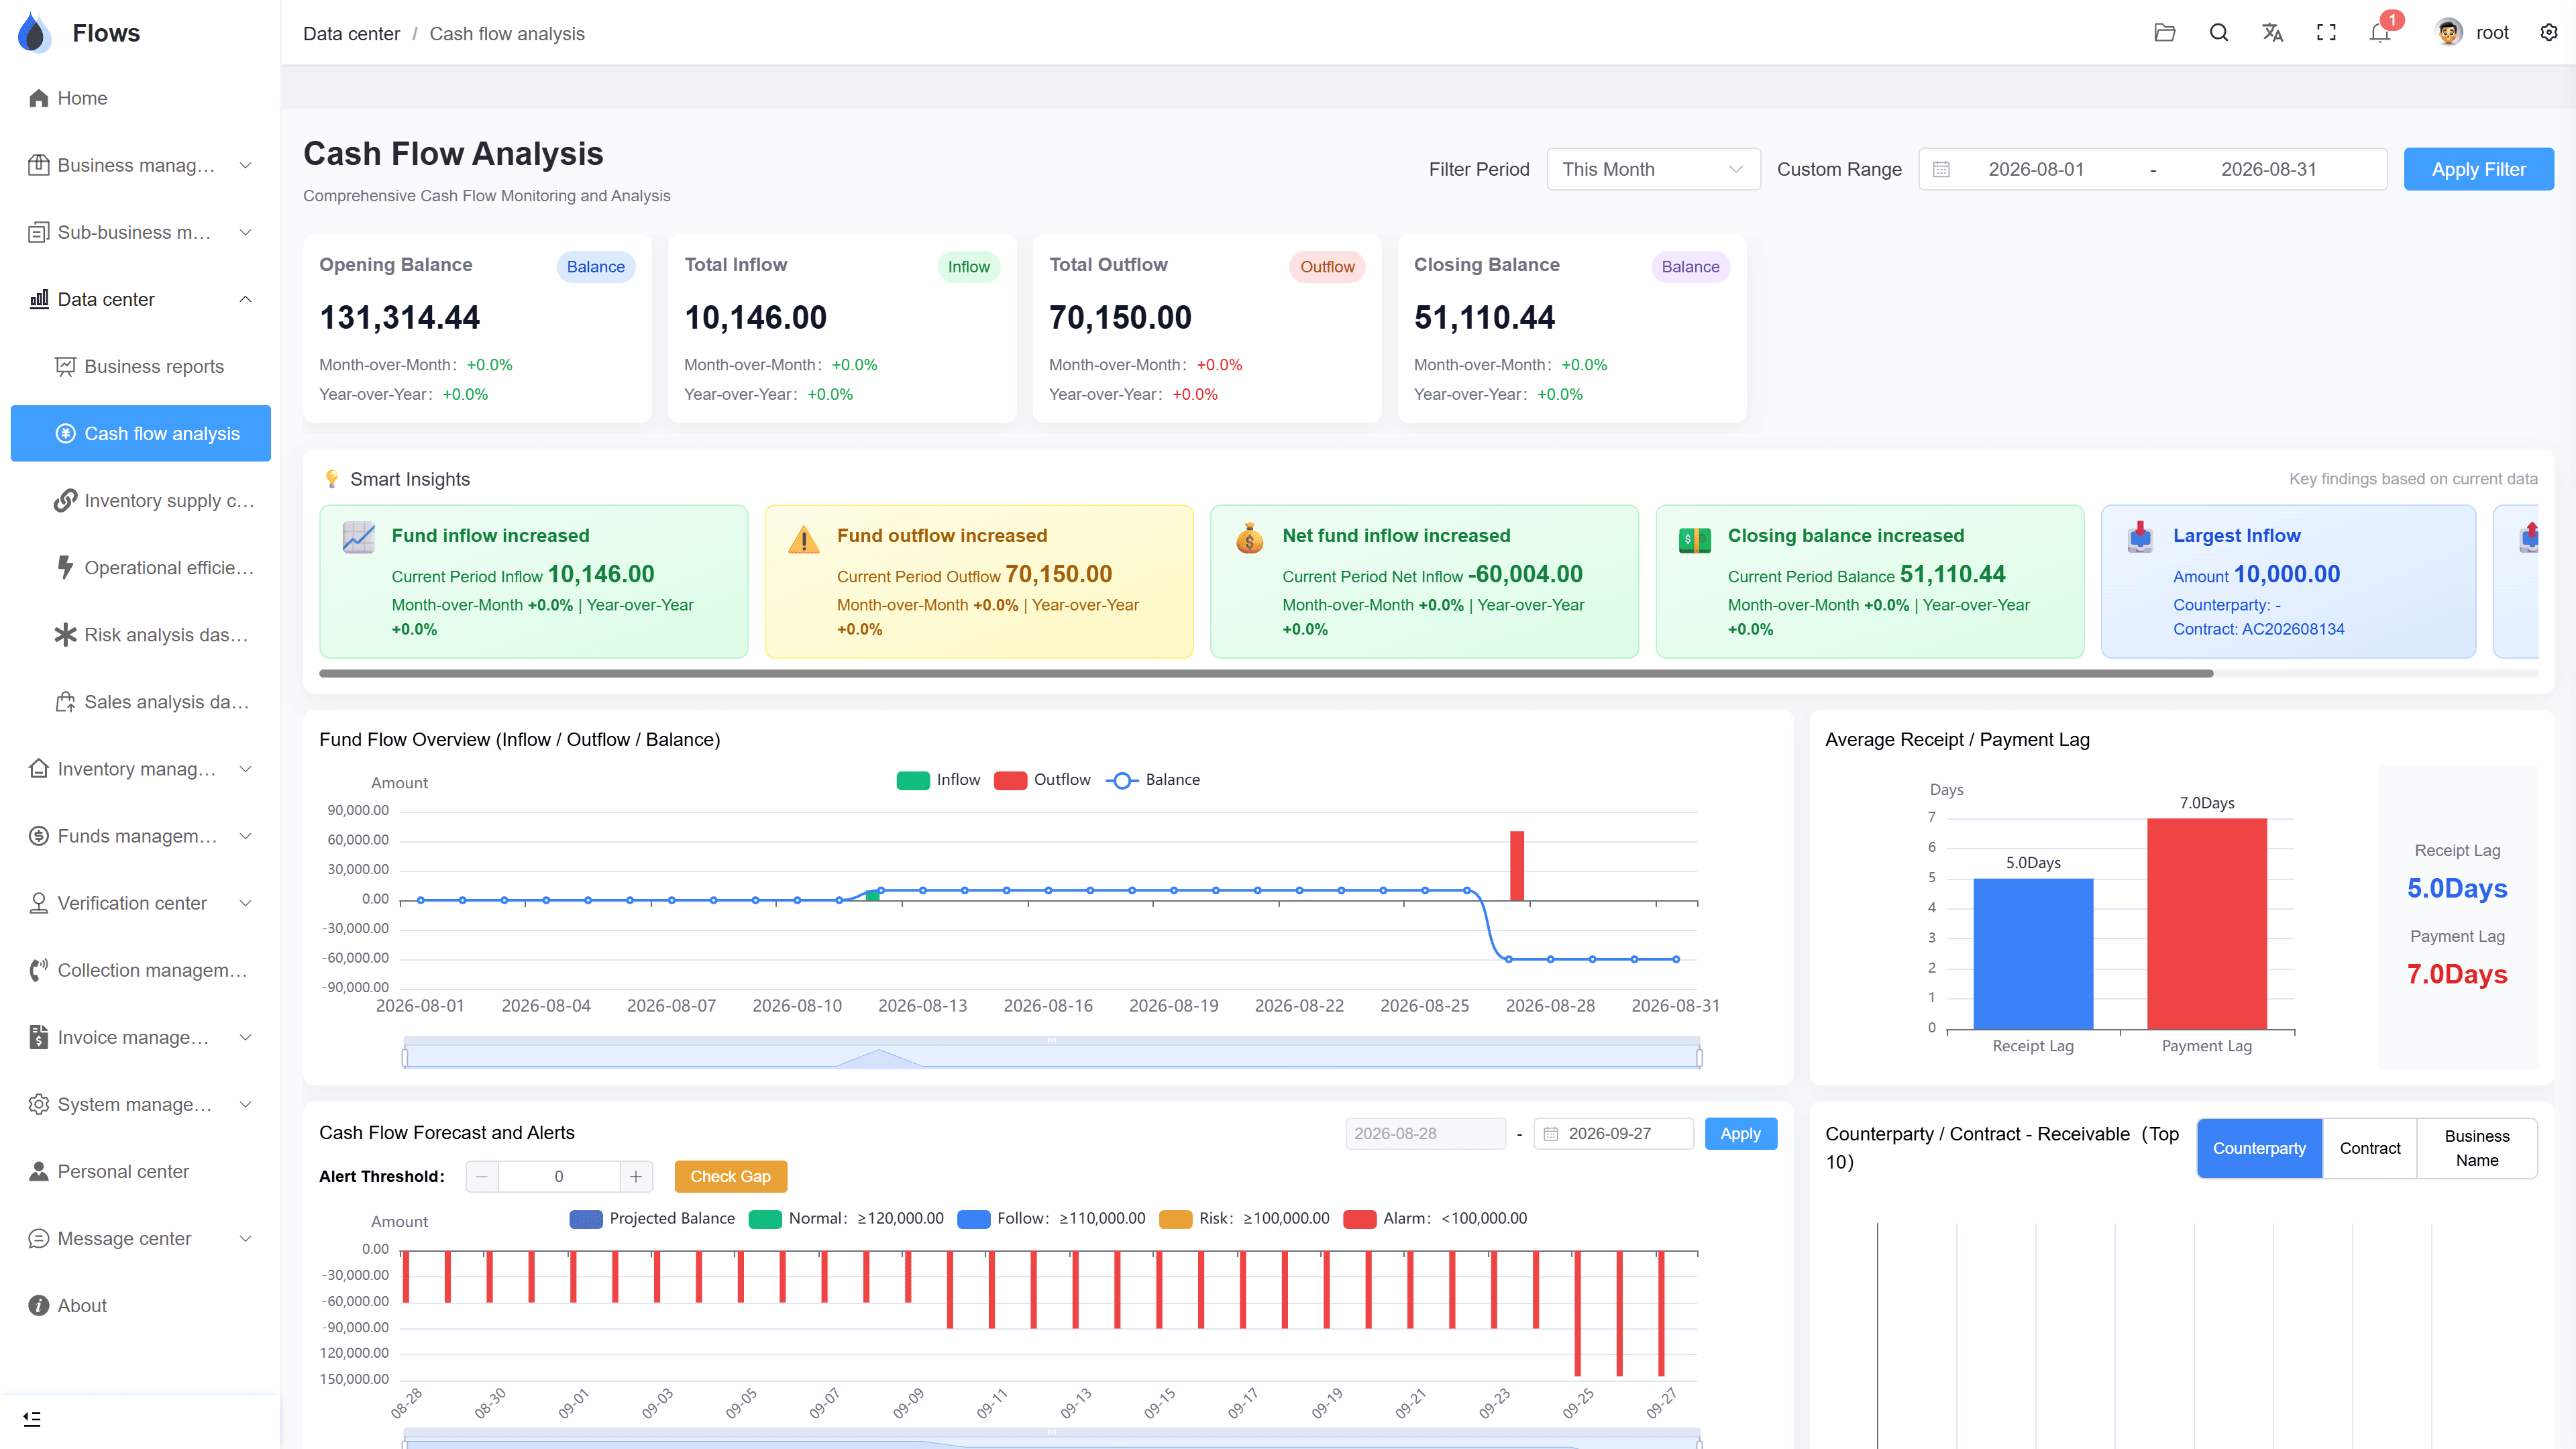
Cash-flow dashboard
Balances, inflow versus outflow, and the plan-versus-actual comparison for the current period.
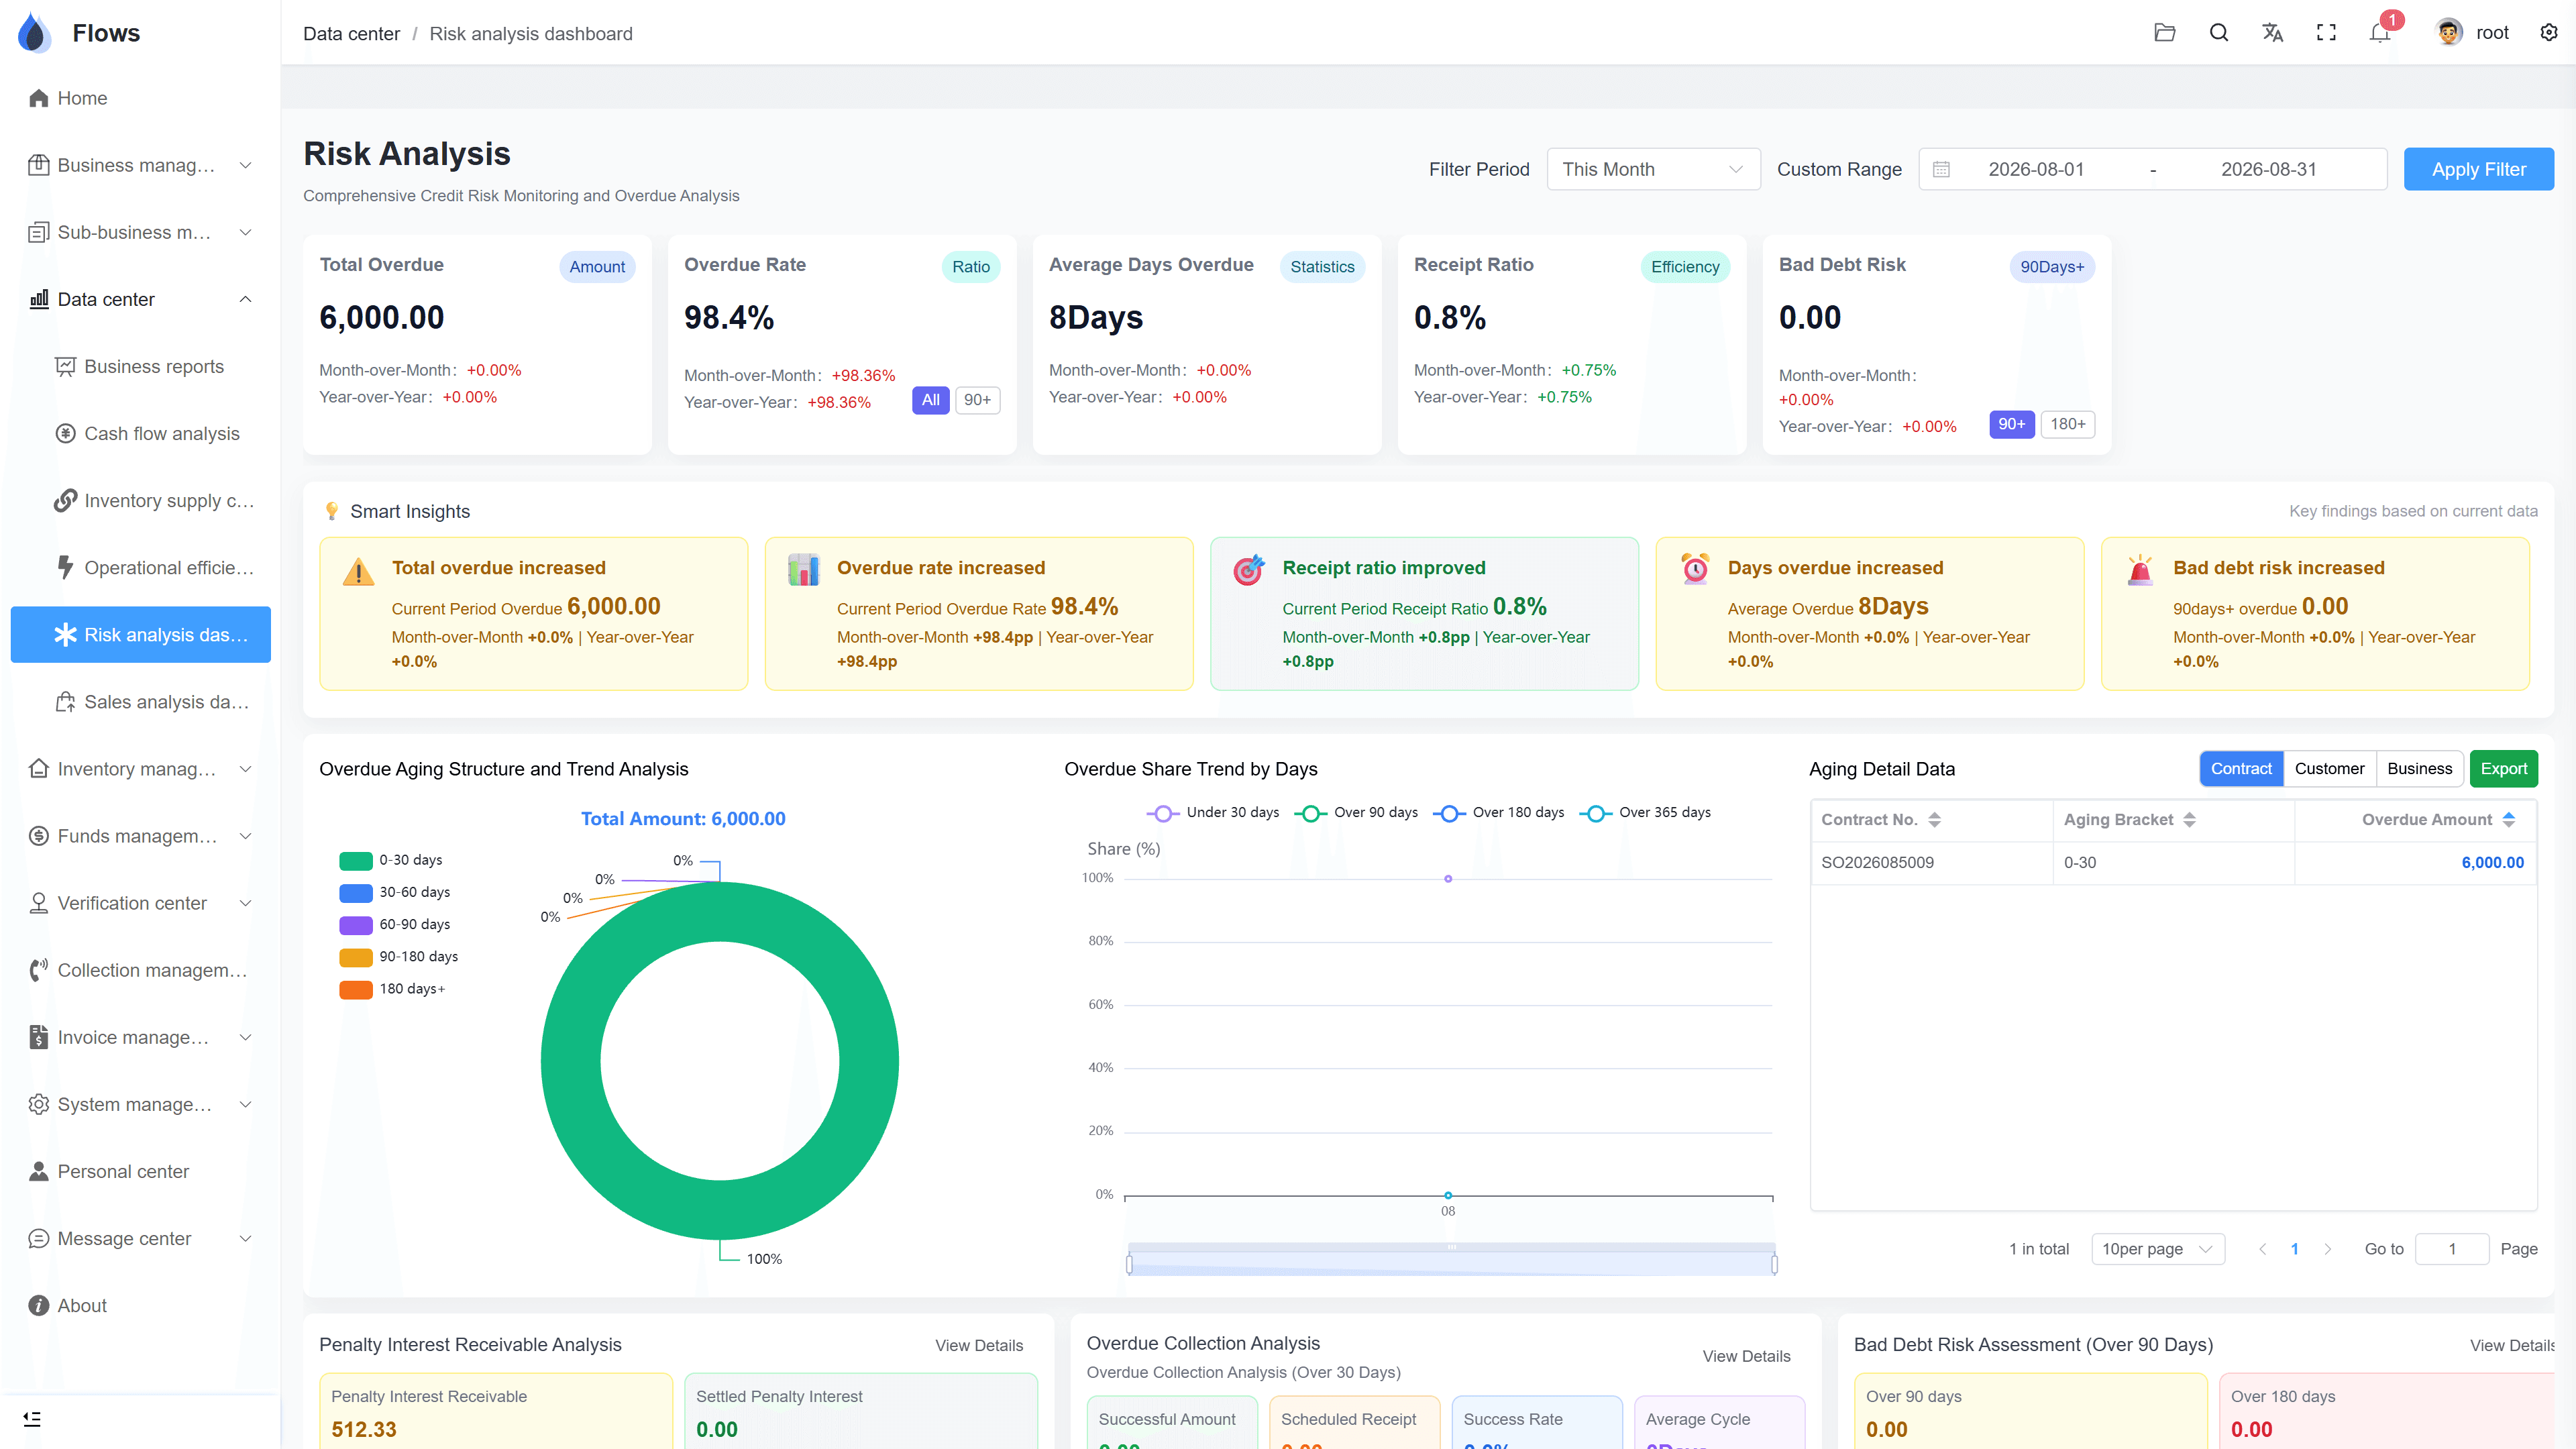
Risk analysis dashboard
Overdue customers, aging buckets, penalty statistics, and post-overdue recovery rates.
Why Flows
What makes Flows different
Not another generic ERP — a system built around how Thai SMEs actually buy, sell, and collect.
See how onboarding works →Priced per company, not per seat
One annual price, every module included. Add users freely within your tier — no feature gates, no seat fees.
Three languages with auto-translation
Thai, English & Chinese UI — and the data your team enters is translated automatically, so everyone reads the same records.
Your documents, exactly your format
Send us your invoice and receipt templates; our team configures them into Flows. Every document comes out looking like yours.
We walk you live — and stay
Five-step onboarding at no extra cost, then quarterly system stability reports. We don't disappear after go-live.
Spec sheet
What the data center ships with — included in every plan.
Statistics report
By period · by contract · by customer/supplier, AR & AP views
Cash flow
Balances, in/out, plan vs. actual, forecast
Supply chain
Stock quantity & value, receiving timeliness, turnover, shortage prediction
Efficiency
AR/AP turnover rates & days, aging, product turnover
Risk
Overdue status & aging, penalty statistics, recovery rate
Sales
Gross margin, top customers & products, distribution, growth
Export
Excel export across reports, attachments included
Freshness
Live — built from the records as they're entered
Frequently asked questions
What dashboards does the Flows data center include?
Six views: the combined statistics report (sliceable by period, contract, or counterparty, with AR and AP sides plus product in-out), and five analysis dashboards — cash flow, supply chain, operational efficiency, credit risk, and sales.
Do we need to build reports or connect a BI tool?
No. The dashboards are built in and populate from the records your team already enters. If you want to model further, everything exports to Excel — the common path for month-end packs.
How fresh are the numbers?
Live. A write-off entered at 10:00 is in the cash and efficiency views at 10:00 — there's no batch job or overnight sync, because the dashboards read the same records the operations write.
Can we see profit by product or by customer?
The sales analysis covers gross margin, top customers, top products, sales distribution, and growth — enough to see where the profit actually comes from and what deserves more attention.
What does the risk dashboard watch?
Overdue customers and amounts, aging buckets, penalty-interest statistics, and how well overdue debts are eventually recovered — the early-warning view for credit decisions and collections priorities.
Can we export a report for the bank or our accountant?
Yes — the statistics report and dashboard data export to Excel, attachments included, so the month-end pack is an export rather than a rebuild.
See this month the way the numbers see it.
Start a free one-month trial, or book a demo and watch the dashboards fill with your own sample data.